C3S Press Data Portal
C3S Press Data Portal

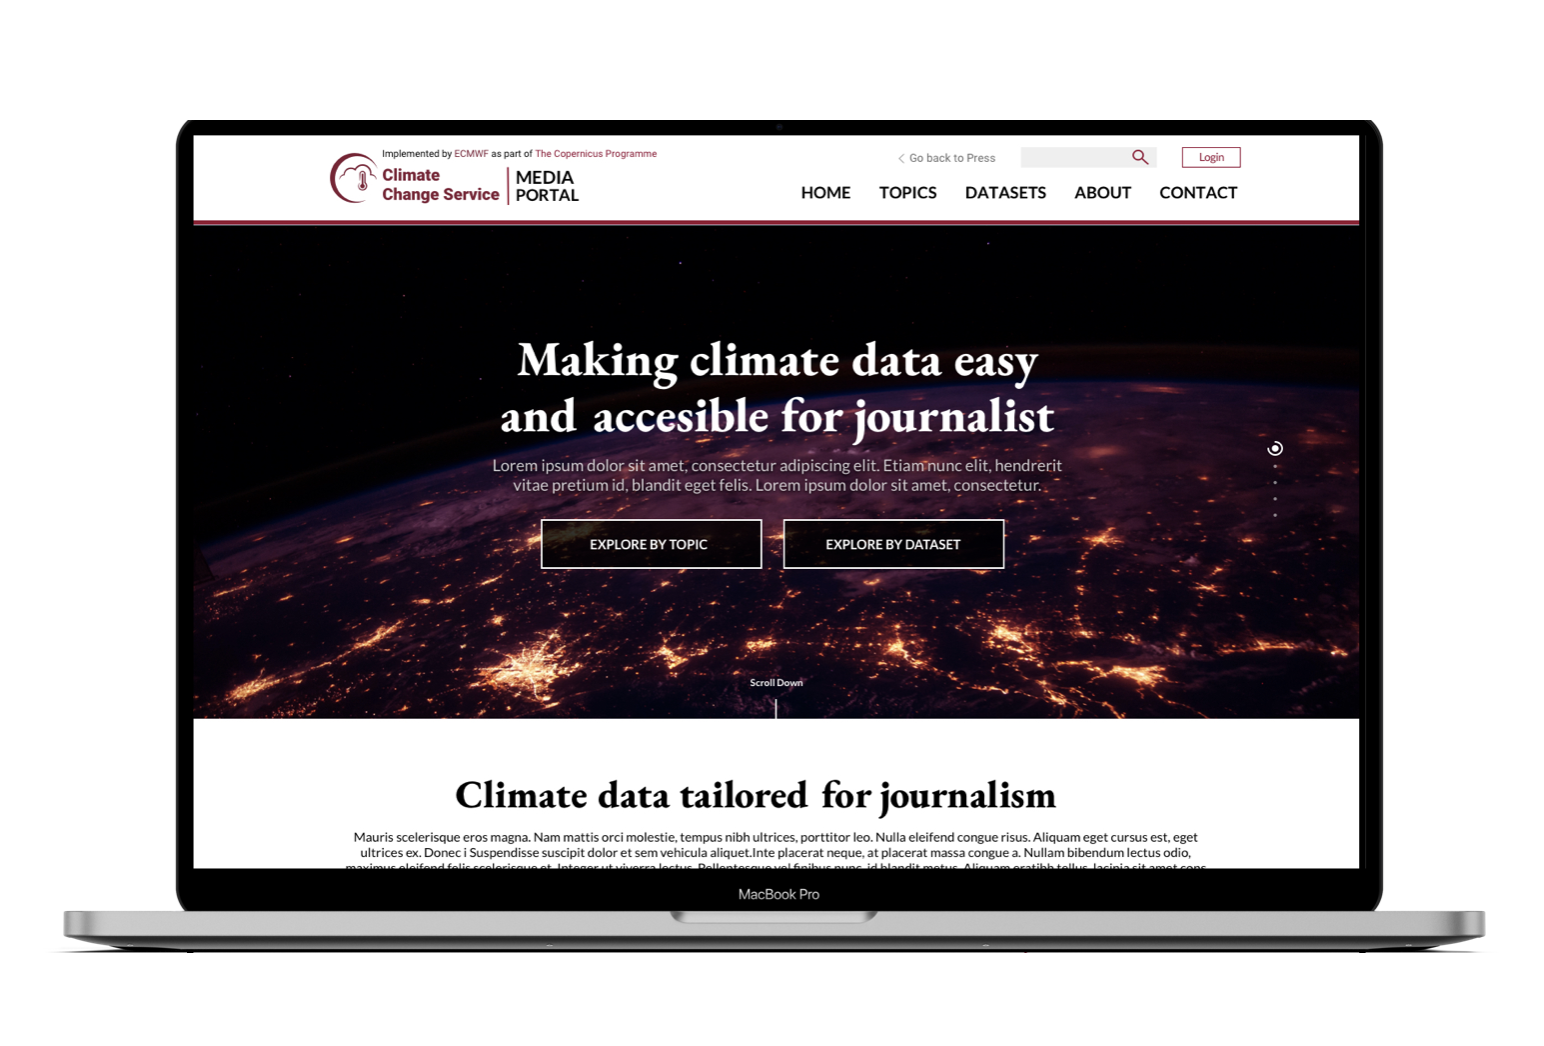
The C3S Press Data Portal aims to provide journalists and inexperienced users of climate data with a platform to easily access and use the data and products available in the C3S Climate Data Store. The portal will allow journalists to extract tailored and compelling visualisations to create robust, evidence-based and impactful stories related to climate change.
Copernicus C3S Press Data Portal
The goal for this project was to create a user-friendly platform designed specifically for journalists. This tool offers an intuitive interface that simplifies the process of extracting and presenting data from the Climate Data Store.
How might we bridge the gap between complex climate data and effective communication in a tailor-made portal designed for journalist?
My Role: Lead product designer
UX designer first iteration: Luz Calvo, Project Lead and manager: Isadora Jimenez, Development: David García and CASE group from the BSC, Content design: Andria Nicodemou and Marta Terrado
User research
We used a variety of research approaches in our effort to create a smooth and human centered experience.
-
We initiated the process by conducting comprehensive desk research to gather existing knowledge and insights relevant to our project's scope, this allowed us to gain a solid foundation of understanding and identify key areas of focus.
-
We conducted in-depth interviews with relevant experts and stakeholders. These interviews delved deep into their perspectives, experiences, and expertise, offering valuable qualitative insights that enriched our design approach.
-
An essential step involved conducting user testing with the initial prototype that was developed. This allowed us to put our design to the test with real users who belonged to our target audience. During these testing sessions, participants had the opportunity to interact with the prototype and share their thoughts, experiences, and suggestions. This phase helped us making iterative adjustments to the prototype, we were able to enhance its usability, effectiveness, and overall user experience.


Concept Development:
The insights we gained from our user experience research were instrumental in shaping our design approach. These insights led us to recognize the importance of making the steps to use the portal—Explore, Select, and Download—clear and simple. Since our portal is primarily aimed at journalists who might not be well-versed in climate data, we understood the need for an intuitive and user-friendly interface.
Design Process:
To cater to the needs of our target audience, we designed the portal with a user-friendly information architecture. This structure allows users to easily explore data categorized by topics, helping them find relevant datasets without confusion. Each dataset is accompanied by comprehensive descriptions, providing users with a clear overview of its contents.
The heart of our project lies in ensuring that users can effortlessly explore datasets and craft visualizations through the interface. Our priority was to create an environment where users could navigate datasets with ease, using an intuitive interface that allows them to interact with various variables and aggregations. This functionality was designed to provide journalists the freedom to curate and visualize data in ways that best suit their storytelling needs. By prioritizing this capability, we aimed to empower journalists to craft impactful narratives backed by data-driven insights, even if they lacked extensive expertise in climate science.
User interface Design:
During the design process, we built upon a preliminary prototype that had been developed by a segment of our team. As we progressed, we closely followed an iterative approach to refine and enhance the design. This involved a comprehensive overhaul of the entire portal, starting from initial sketches and testing using a low-fidelity prototype. By doing so, we ensured that every aspect of the portal was purposefully reconsidered and optimized for user experience and functionality.
As the design evolved, we paid special attention to harmonizing the visual elements with the Copernicus Climate Change brand style. This ensured that our portal seamlessly integrated into the demonstrator's overall context.
User Interface Design:
During the design process, we built upon a preliminary prototype that had been developed by a segment of our team. As we progressed, we closely followed an iterative approach to refine and enhance the design. This involved a comprehensive overhaul of the entire portal, starting from initial sketches and testing using a low-fidelity prototype. By doing so, we ensured that every aspect of the portal was purposefully reconsidered and optimized for user experience and functionality.
As the design evolved, we paid special attention to harmonizing the visual elements with the Copernicus Climate Change brand style. This ensured that our portal seamlessly integrated into the demonstrator's overall context.
Final Design and Features:
The Press Data Portal is demonstrating how data from the CDS can be used to address the key challenges of working with robust climate data in journalism. It has been developed with a subset of the data available on the CDS and can be extended to other topics, datasets and variables if there is a demand from journalists and other stakeholders. The project stays as a private link since it stayed as a demonstrator prototype.
This project was one of the four nominees for the C3S gala awards of 2021 in the category “Creating impactful visualization and communication material and promoting C3S to user communities”